Data Science and Big Data
Data science definition
"Data science is an interdisciplinary field that uses scientific methods, processes, algorithms and systems to extract knowledge and insights from data in various forms, both structured and unstructured."
"Data science is a 'concept to unify statistics, data analysis, machine learning and their related methods' in order to 'understand and analyze actual phenomena' with data. It employs techniques and theories drawn from many fields within the context of mathematics, statistics, information science, and computer science." -- Wikipedia (November 13, 2018)
Big data concept
The term "big data" was first corned in 1997 by the NASA astronomers Michael Cox and David Ellsworth regarding the big quantity of information generated by the supercomputers, which was published in the Proceedings of the IEEE 8th Conference entitled "Application-controlled demand paging for out-of-core visualization" from the ACM digital library.
"Big data is high-volume, high-velocity and/or high-variety information assets that demand cost-effective, innovative forms of information processing that enable enhanced insight, decision making, and process automation." -- Gartner (2012)
Accordingly, big data have three defining properties/dimensions including (1) volume (quantity), (2) variety (types: structured, semi-structured and unstructured) and (3) velocity (streaming data with speed). The variety of big data implies any of the following types:
- Structured data: RDBMS data, easily retrieved through SQL.
- Semi-structured data: data in files (xml, json docs, NoSQL database).
- Unstructured data: images, videos, text files etc.
Big Data Analytics
Data processing and analytics
Data processing and analytics include building and training machine learning models, manipulating data with technology, extracting information from data as well as building data tools, applications, and services. It may consist of the following major steps:
- Framing the problem
- Data acquisition for the problem
- Data wrangling
- Machine learning
- Developing a statistical/mathematical model
- Data visualization
- Communicating the output of the analysis: (1) data report, and (2) data products.
Python libraries and packages for big data analysis in data sciences
- Data wrangling: pandas (data analysis).
- Data exploring: matplotlib (graphics computing).
- Developing model: scikit-learn (machine learning: data mining & analysis), NumPy (scientific computing).
- Visualization: Bokeh (interactive visualization library for browsers), SciPy (science, math & engineering).
The outcomes from big data analysis
- Descriptive: to generate descriptive details from the big data.
- Predictive: to create a model from the big data and predict likely outcomes.
- Prescriptive: to recommend corresponding actions based on the existing information.
Machine Learning
What is machine learning?
The term "machine learning" was originally given by Arthur Samuel in 1959, which is "a subset of artificial intelligence (AI) in the field of computer science that often uses statistical techniques to give computers the ability to 'learn' with data, without being explicitly programmed". Arthur Samuel is considered a pioneer of AI and computer gaming from IBM in the United States.
Machine learning algorithms
The machine learning algorithms can be divided into three categories: supervised, unsupervised, and reinforcement algorithms (Fig. on the right). (1) Supervised algorithms: it requires the input and an expected output for the data. The variables from the model are adjusted during the testing process so that the output closes to the expected value/goals. (2) Unsupervised algorithms: it has input but there is no particular outcome expected from the testing phase. The algorithms may cluster the data sets together for different outcomes. (3) Reinforcement algorithms: it trains the algorithms for improvement after each decision, based on its output (success or failure). Listed below are some of the popular machine learning algorithms.
- Decision tree: Decision tree algorithm is a type of supervised machine learning where the data continuously get split based on specific parameter, i.e. an output is generated based on the input from the training data. The tree is formed with two entities, namely the decision nodes (where the data is split) and the leaves (the decisions). In other words, it classifies a set of existing data into different groups according certain attributes, perform a test at each node, through branch judgement, and continuously split the data into additional distinct groups. The tests are made on the existing data, and when new data come in they can be classified to the corresponding groups.
There are two main types of Decision Trees including (1) Classification trees (Yes/No types): The decision variable is categorical; (2) Regression trees (continuous data types): The decision or the outcome variable is continuous such as an actual number. The two common decision tree algorithms include Random Forests (it builds different classifiers using a random subset of attributes and combines them for output) and Boosting Trees (it trains a cascade of trees one on top of others by correcting the mistakes of ones below them). - Linear regression: Linear regression is used to predict the value of an outcome variable (Y) based on one or more input predictor variables (X). Its objective is to develop a model that the dependent variable (Y) is expressed as a mathematical function of one or more independent variables (X), so that we can use the regression model to predict Y if X is known. The mathematical function can be expressed below (such as simple linear regression with one independent variable):
where,is the intercept and
is the slope, which are both called regression coefficients. ϵ is the error term for the portion of Y where the regression model cannot explain.
The t-statistic () is used to test the significance of the individual regression coefficients while the F-statistic (
) is for the test of goodness of fit for the regression model, where:
and
, while
where, n is the number of observations, q is the number of coefficients,is the fitted value for observation i and
is the mean of Y.
and
:
and
, which have the following relationship:
where, k is the number of independent variables in the model, excluding the constant.
- Logistic regression: Logistic regression was developed by the statistician David Cox in 1958 and is one of the popular machine learning algorithms for binary classification. It measures the relationship between the dependent variable and the independent variables by estimating the probabilities using its underlying logistic function which is also called the sigmoid function as shown below:
The probabilities are then transformed into binary values to make a prediction based on the logistic function. It aims to maximize the likelihood that a random data point is classified correctly into one of the two possible outcomes or dichotomy using Maximum Likelihood Estimation.
- Naive Bayes: It is a simple but powerful classification technique for predictive modeling based on Bayes' Theorem assuming the independence among predictors or independent variables. The model may include two types of probabilities which may be obtained from the training data: (1) The probability for each class; (2) The conditional probability for each class given a value for each of the independent variables. The probability model is used for making predictions for new data using Bayes Theorem:
where, A and B are two separate events, and:
P(A|B) is the conditional probability of the hypothesis that event A occurs , given that the predictor B has occurred (the evidence), which is also called the posterior probability of class (the target A).
P(A) is the probability of hypothesis A being true, which is also called the prior probability.
P(B) is the prior probability of the evidence or the predictor B (regardless of the hypothesis).
P(B|A) is the conditional probability (or likelihood) that event B occurs (the evidence), given that the hypothesis A is true.
Therefore, Bayes' Theorem (or Bayes' rule) can also be expressed as:
- K-nearest neighbors (K-NN): K-NN is one of the simple but robust and widely used classification algorithms for supervised machine learning. It is a non-parametric technique without a need to make any underlying assumptions about the distribution of data. It has many applications including pattern recognition, data mining (including text mining), intrusion detection, finance, medicine and genetics (such as gene assignment in functional genomics according to gene expression profiles), etc. It is also frequently used for other complex classifiers such as artificial neural networks (ANN) and support vector machines (SVM).
This algorithm uses the memorized training data points for the K instances that are most close or similar to the new instance (e.g., distance function) and assigns to it the most common class. In other words, the unknown data point can be predicted for its appropriate classification based on which k data points of the training set are the closest to it using the following Euclidean distance for continuous variables.
The Euclidean distance between an existing point (a) and a new point (b), i.e., across all input attributes i is given by:
- K-means: k-means algorithm is a type of unsupervised machine learning for clustering when the data are unlabeled or the data don't have predefined categories or groups. This algorithm aims to find groups in the data with a variable K being the number of groups. Each of the data points are assigned to one of the K groups based on the similarity of the features provided. Iteration of the K-means clustering algorithm will result in: (a) The centroids of the K clusters that can further be used for labeling new data, (b).Labels of the training data after the data are assigned to different clusters based on the least distance between its centroid and the data point.
The procedure of k-means clustering includes:- Initializing the k-means: (1) assigning a value to k (for instance, k=3), (2) randomly assign each data point to any of the 3 (or k) clusters and (3) calculate the cluster centroid for each of the clusters.
- Associating each data point to a cluster by reassigning each point to its closest cluster centroid.
- Recalculating the centroids for the new clusters.
- Iterating the procedures 2 and 3 until switching of data points from one cluster to another is no longer needed. By then, the k-means algorithm exits.
, each of them is a dimensional real vector, k-means clustering is to partition the n observations into k (
) sets of clusters, i.e.
, in order to minimize the within-cluster sum of squares (WCSS) (thus the variance). Then, for effective clustering, it is essential to find:
where,is the mean of all points in the
cluster
.
- Support vector machine: Support vector machines (SVMs) are supervised machine learning models which are similar to linear or logistic regression except that they have different margin-based loss functions. They are binary classification algorithms that can analyze data for classification and regression analysis.
- Random forest: Random Forest is to select randomly from the original data and then form into different subsets. It is an advanced decision tree which is highly complex and each tree of the random forest works through the model of a decision tree algorithm.
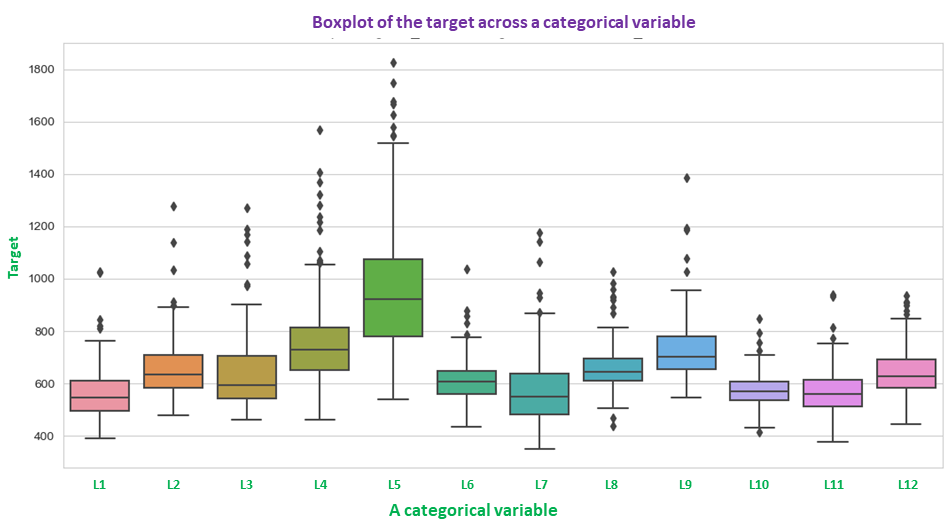
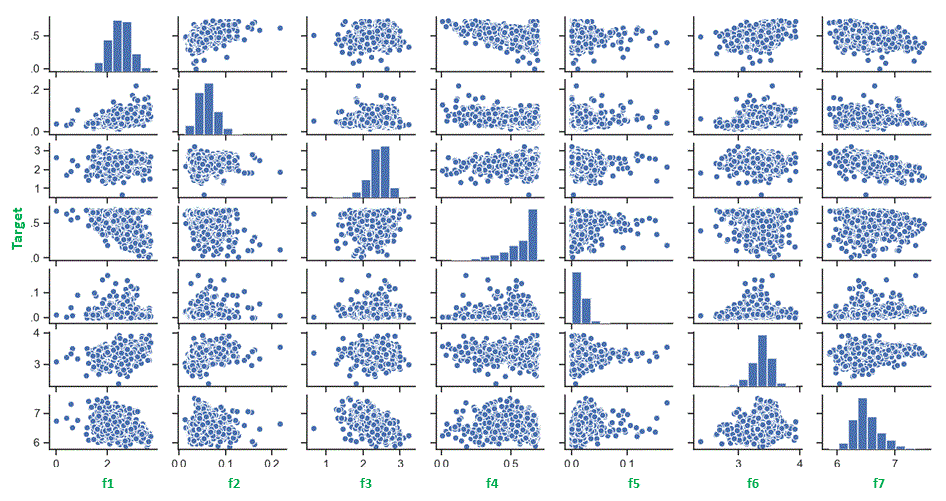
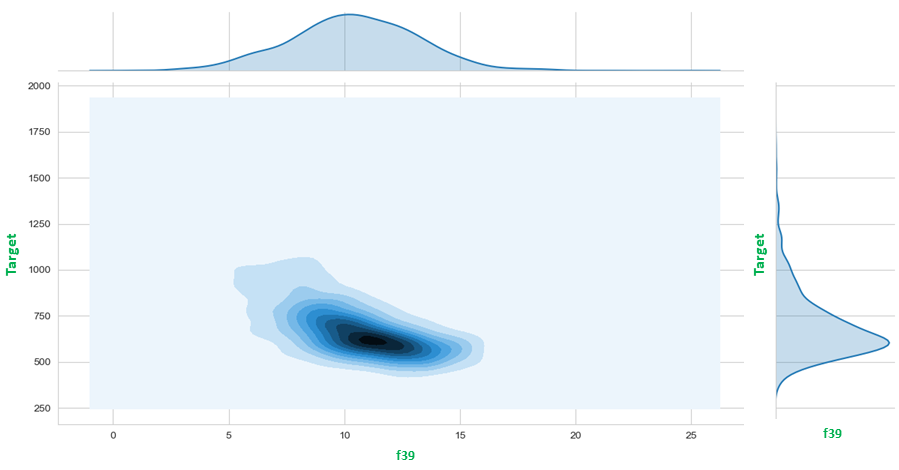
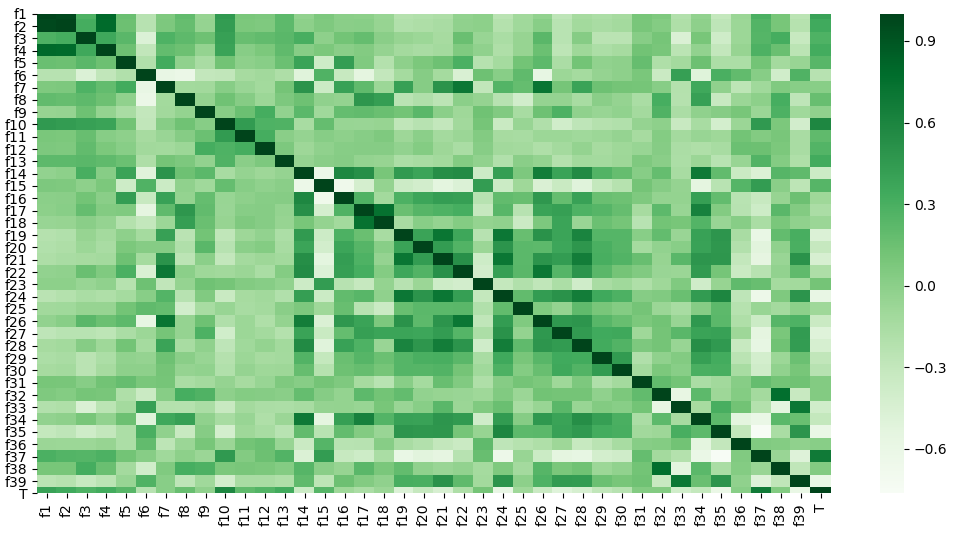
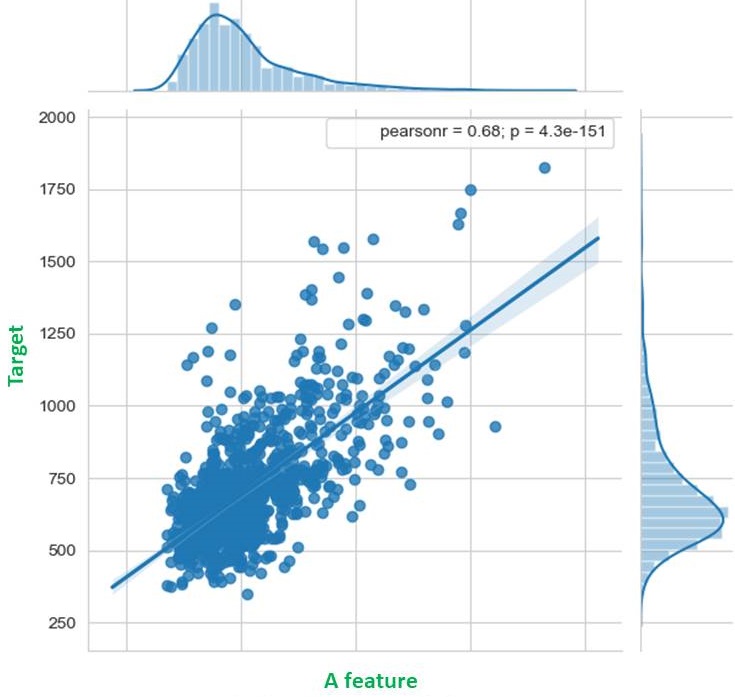
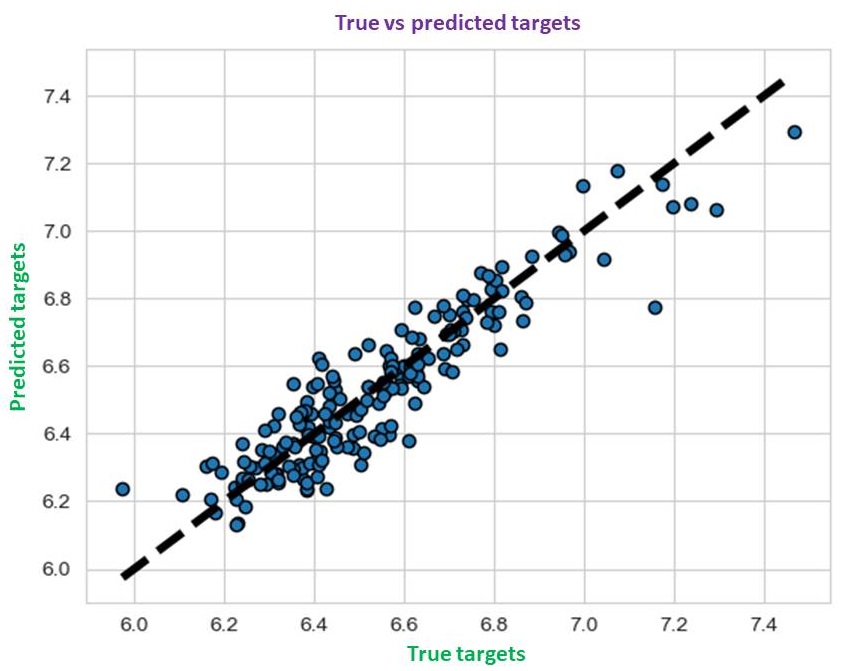
Machine learning snapshots
The examples of commonly used machine learning algorithms include: (1) Linear Regression, (2) Random Forest, (3) AdaBoost, (4) Decision Tree, (5) Logistic Regression, (5) Support Vector Machine (SVM) and (6) XGBoost. Some of the snapshots from one of the machine learning projects are listed in the right column including data visualizations (boxplot, pairwise scatter plot and contour plot), heatmap of correlations across all features and the target, features selection, and the plot of predicted vs actual targets, etc.
Deep Learning
What is deep learning?
Deep learning is a subfield of machine learning using artificial or deep neural networks to train the computer to perform human-like tasks such as image and speech recognition. Deep learning is currently at the cutting edge of machine learning (ML) and artificial intelligence (AI) which has led to the breakthroughs such as audio processing, computer vision as well as self-driving cars, etc.
Most of the deep learning methods use neural network architectures, thus the deep learning models are usually considered as deep neural networks where "deep" relates to the number of hidden layers in the neural network and the Networks may have tens or hundreds of hidden layers.
Packages for deep learning
Python has a number of deep learning libraries and listed below are the most useful libraries that support different deep learning architectures such as auto-encoders, recurrent neural networks (RNNs), convolutional neural networks (CNNs) and feed-forward networks etc..
- Theano: is a low-level and major foundational library with tight integration with NumPy for fast and efficient numerical computation that can be run on the CPU or GPU architectures.
- TensorFlow: is a low-level library less mature than Theano for fast numerical computing which is supported by Google for out-of-the-box distributed computing. It is a foundation library for creating Deep Learning models directly or by using wrapper libraries that simplify the process built on top of TensorFlow.
- Keras: is a heavyweight wrapper for Theano and Tensorflow. Keras is a high-level neural networks API and is modular for rapid experimentation.
- Lasagne: is a lightweight wrapper for Theano for building and training neural networks, which provides the flexibility of Theano and the neural network layers to be used.
- MXNet: is a high-level library similar to Keras. The framework provides bindings for multiple languages and support for distributed computing that is designed for efficiency, flexibility and the productivity.
Big Data Analytics Platforms
Hadoop and Spark are currently the two frameworks for Big Data with some of the most popular tools for analytics. However, both of them do not perform identical tasks but rather can work together.
Apache Hadoop
Apache Hadoop was initially a Yahoo project in 2006 prior to gradually becoming a top-level Apache open-source software framework for storing data and running applications on clusters of hardware with enormous processing power and the capability of simultaneously handling virtually unlimited tasks.
As a collection of open-source software utilities, Apache Hadoop has several components (the top three are the basic components):
- HDFS (Hadoop Distributed File System): This is the main data storage system including the centerpiece of NameNode or the Master (for metadata) and DataNode architecture (for actual datasets) for high-performance access to data across highly scalable Hadoop clusters.
- YARN (Yet Another Resource Negotiator): This is the resource management layer with a schedule for application runtimes.
- MapReduce: This is a software framework for writing applications (algorithms) to process huge amount of datasets (multi-terabyte) in parallel on large clusters (thousands of nodes) of commodity hardware in a reliable manner. Hadoop is built in Java but is accessible for writing MapReduce code through many programming languages including Python.
- Sqoop: Apache Sqoop is the command-line interface application designed for efficiently transferring bulk data between Apache Hadoop (HDFS) and external datastores such as relational databases or enterprise data warehouses.
- Hive: Apache Hive is an open source data warehouse software project built on top of Apache Hadoop for querying and analyzing large datasets of the Hadoop files. It was created in 2007 by Facebook developers for SQL access to Hadoop data. Thus, Hive brings an SQL-like interface allowing users to run queries on HDFS and for Hadoop analytics.
- Mahout: Apache Mahout is an open source project with a library of scalable machine-learning algorithms implemented on top of Apache Hadoop and using the MapReduce paradigm. Once big data come into HDFS, Mahout provides the relevant tools to automatically find meaningful patterns for the big datasets. Thus, the Apache Mahout can facilitate turning big data into big information. Mahout mainly functions in the following four aspects:
- Collaborative filtering: tracks user behavior and makes similar recommendations of products such as Amazon recommendations.
- Clustering: clustering similar items in the same group.
- Classification: learning from existing categories and then assigning unclassified items into the most appropriate category.
- Frequent item-set mining: learning existing items in a group such as in a shopping cart or terms from a query session and identifying which items or terms usually appear simultaneously.
Apache Spark
Apache Spark is a general-purpose cluster computing system or platform with high-level tools for structured data processing, machine learning, graphics processing and streaming. It was initially a project created in 2012 by the AMPLab (Algorithms, Machines and People Lab) at UC Berkeley. As a top-level Apache project, it processes datasets in parallel across a cluster of hardware. Spark differs from Hadoop in that Hadoop reads and writes files into HDFS while Spark processes data in RAM using an RDD (Resilient Distributed Dataset).
The essential components of Apache Spark include:
- Spark Core: Spark Core is the foundation of the project that contains the basic components to provide distributed task dispatching, scheduling, memory management, fault recovery, interacting with storage systems, and basic I/O functionalities. Spark Core has the API called resilient distributed datasets (RDDs) as the main programming abstraction representing all the items distributed across different compute nodes which can be manipulated in parallel for processing huge dataset. It is the capability of in-memory computation that generates high speed for Apache Spark compared with Apache Hadoop.
- Spark SQL: Spark SQL is a Spark module or the component on top of Spark Core that introduces a data abstraction named DataFrames for structured and semi-structured data that can be queried using SQL or the Hive Query Language (HQL), an SQL variant, with support for different data sources such as Hive tables, JSON and Parquet. Spark SQL provides a domain-specific language (DSL) to manipulate DataFrames in Scala, Python and Java, as well as the SQL language support with command-line interfaces and the Open Database Connectivity (ODBC) /Java Database Connectivity (JDBC) server.
- Spark Streaming: Spark Streaming is able to perform streaming analytics through Spark Core's fast scheduling capability. It is the component for real time processing of live streams of data such as social media, the log files from production web server, and queues of messages from web users. After receiving input data streams, Spark Streaming divides them into batches for processing by the Spark engine and then generating final stream of results in batches.
- Spark MLlib: Spark MLlib is a distributed machine-learning library or framework on top of Spark Core that provides multiple types of machine learning algorithms, which are designed to scale out across a cluster, with classification, regression, clustering, collaborative filtering, and so as well as supporting functionality such as model evaluation and data import. . Some of the algorithms work with streaming data including linear regression using ordinary least squares or k-means clustering.
- GraphX: GraphX is an API and a distributed graph-processing framework or library on top of Apache Spark for manipulating graphs and performing graph-parallel operations. Like Spark SQL and Spark Streaming, GraphX is based on the Spark RDD API and functions as an engine for network graph analytics with data store, which has the capability of clustering, classification, traversal, searching, and pathfinding in graphs. It can optimize the formation of vertices and edges with arbitrary properties for the primitive data types and has various operators for manipulating graphs, such as subgraph and mapVertices, and a library of common graph algorithms including PageRank and triangle counting, etc.
ChatGPT and ChatGPT-4
What are ChatGPT and ChatGPT-4?
ChatGPT is an artificial-intelligence chatbot that has been developed by OpenAI and launched in November 2022. It was built on top of OpenAI's GPT-3.5 and GPT-4 families of large language models (LLMs) and fine-tuned using both supervised and reinforcement learning techniques. GPT-4 is a large multimodal model that accepts image and text inputs, emitting text outputs. It exhibits human-level performance on various professional and academic benchmarks.
Microsoft co-founder Bill Gates said that ChatGPT is the most 'revolutionary' tech in 40 years. 'The Age of AI Has Begun': Bill Gates Says. This 'Revolutionary' Tech is the Biggest Innovation Since the User-Friendly Computer.
ChatGPT has become a powerful tool that can be used in a variety of ways to enhance productivity across many areas. ChatGPT-4 is more accurate, creative and collaborative than the previous iteration, ChatGPT-3.5, and "40% more likely" to produce factual responses. Together, they offer a wonderfully intriguing method of interacting with and producing content that sounds amazingly human.
How does ChatGPT work?
To generate responses, ChatGPT uses a multi-layer transformer network, which is a type of deep learning architecture that has proven to be effective at processing natural language. The model takes an input sentence, processes it using its internal knowledge, and then generates a response that is relevant to the input. Once you give ChatGPT a question or prompt, it passes through the AI model and the chatbot produces a response based on the information you've given and how that fits into its vast amount of training data. It's during this training that ChatGPT has learned what word, or sequence of words, typically follows the last one in a given context. ChatGPT works by attempting to understand your prompt and then spitting out strings of words that it predicts will best answer your question, based on the data it was trained on.
In addition, the newer version ChatGPT-4 (GPT-4 API) can handle both text and images in contrast to the present version of ChatGPT which can process image inputs in addition to text inputs. GPT-4's multimodal capability can process different types of images such as photographs, screenshots or even hand-drawn pictures. The approach is to use an image recognition model to identify objects or scenes in the image and provide this information as text input to ChatGPT-4. For example, an image recognition model could identify that an image contains dog, flowers or text, and provide this information as text input to ChatGPT-4. ChatGPT-4 could then generate a response based on this information.
What can ChatGPT do?
ChatGPT uses a deep learning technique called Transformer, which allows it to generate natural language text similar to human writing. ChatGPT can help translate language, answer questions, summarize text, write creatively and more. Long and short of it, ChatGPT is a super versatile tool that can do and be almost everything! It's essentially a chatbot that's designed to assist you in any way it can, drawing up a huge bank of information and machine language learning to answer questions.
Besides, ChatGPT can even find and fix code errors for programmers. Take GitHub Copilot for example, it is an AI-powered code completion tool developed by OpenAI in collaboration with GitHub. The AI tool can also be incorporated into different code editors. It is designed to assist developers in writing code faster and with fewer errors by suggesting code snippets and auto-completing code as they type.
Are answers from ChatGPT accurate?
ChatGPT is likely to give correct answers to most general knowledge questions most of the time, but it can easily go wrong or seem to be making things up ("hallucinating," as the developers sometimes call it) when the question is phrased in an unusual way or concerns a more specialized topic. While testing the tool, it has been concluded that, though its language capabilities are impressive, the accuracy of its responses can't always be trusted. That said, ChatGPT can still be used as a source of inspiration and feedback—but currently not as a source of accurate information (as of April 2023).
Are jobs at risk due to ChatGPT?
According to a report from Goldman Sachs, generative AI has the potential to automate approximately 300 million full-time jobs worldwide, based on an analysis of data on occupational tasks in the US and Europe. Some of the jobs that are at risk of displacement by AI technologies like ChatGPT are white collar jobs, such as data entry clerks, administrative assistants, and insurance underwriters. These jobs typically involve routine and repetitive tasks that can be automated by AI technologies. However, ChatGPT is not the only AI technology that can automate jobs.
Nonetheless, AI will not replace all jobs and that new job roles will emerge as well, such as:
- Conversational AI Engineer or Prompt Engineer
- Data Scientist
- UX (User Experience) Designer
- AI Trainer
- AI Ethicist, etc.
ChatGPT, as an AI language model, is not designed to replace human jobs. Its main purpose is to assist humans in various tasks such as generating text, answering questions, and completing simple tasks. In fact, AI technologies like ChatGPT can help increase productivity and efficiency, which can ultimately create new job opportunities. Therefore, AI will likely complement human labor rather than replace it entirely.